1. Abstract
Camera traps have become a popular method for obtaining information on wildlife species. With the ever growing amounts of studies being performed with this ever adapting technology, it is important to document trends to find applications for their successes in obtaining primary data. These factors will vary depending on landscape, species of interest, and budgets. Researchers need to assess these factors and adapt an implementation plan accordingly. When landscapes are particularly challenging, utilizing transect lines is an effective strategy to obtain primary data on wildlife presence and were found to consist of 40% of the 40 individual camera trap studies analyzed. With species in low density, utilizing a grid system across a species’ known home range size increases probability of high capture rates and were found to consist of 30% of the analyzed studies. In areas of high species density, utilizing fixed stations placed in optimal locations can provide enough cover to obtain bountiful primary data and were shown to make up 27.5% of the analyzed studies. These distribution methods in correlation with a research budget will then determine whether enough camera traps can be purchased to cover each camera trap station or if rotating fewer cameras is ideal to maximize successful data collection. Budget constraints limit the number of camera traps in use, with 42.5% of studies using between 1-25 camera traps and 77.5% of studies using less than 50 camera traps. Furthermore, budget constraints may limit the length of study. Of the analyzed camera trap studies, 57.5% favored lengths up to half a year. Capturing local engagement through citizen science is one way to limit budgetary expense as it can provide field support as well as data analysis support. Additionally, citizen science can further support the goals of conservation by growing ecological knowledge and developing sustainable attitudes and behaviors.
2. Introduction
Camera traps are seen as an ideal method to obtain wildlife population data for their ability to document secretive species ranging from carnivores to herbivores in unruly terrain (Silver, S., 2004; Newey et al., 2015; Harmsen et al., 2017; Parsons et al., 2018; Porfirio et al., 2018) and for their ability to prevent animal habituation to humans (Borchers et al.; 2014, Boyer-Ontl, 2014). With apex predators needing various sized prey species (Iriarte et al., 1990; Taber et al., 1997; Gutiérrez-González, 2017), documenting these prey species as well as the predators themselves can aid in evaluating forest biodiversity, wildlife density, and estimates on populations (Chetkiewicz et al., 2006; Boyd et al., 2007; Zanin et al., 2015). Depending on the location, habitat, species of interest, a variety of methods need to be considered. This literature review will investigate various factors in camera trap studies that play a role in their successes in obtaining primary data.
It is also vital to gain the support of the local stakeholders. By involving them in conserving their forests and documenting the species that live within them, they will simultaneously be developing personal connections to the species through their work as citizen scientists (Parsons et al., 2018). Furthermore, conservationists need accurate population estimates across different habitats in effort to take the best plan of action to protect wildlife species, all of which, can be made far easier by recruiting local volunteers (Silver, 2004). By intertwining these two concepts, local knowledge can grow while attitudes and behaviors change to favor sustainability (Parsons et al., 2018). This literature review will also investigate information on the use of camera traps within citizen science programs to aid in conservation research and developing sustainable attitudes and behaviors towards wildlife while minimizing negative cultural and ecological impact.
3. Methods
My primary methodology was to perform a literature review on peer reviewed publications centered around the use of camera traps to document wildlife presence. Data from 40 individual camera trap studies within 18 peer reviewed publications* was compiled into categories like the number of camera traps used, the quantity of camera trap stations, the length of study, the camera trap distribution methods, the distance of camera traps, the height a camera is set up, as well as various specs of popular research camera trap models still in production as of 2018 in effort to identify how different wildlife conservation projects manage camera trap programs to maximize their successes. This data was further broken down to find trends in the frequency of methodologies across different camera trap studies and to discover any possible connections.
*See Works Cited
4. Results
4.1 Review of Field Studies
Within the 40 individual camera trap studies, the species of interest included large and small felids, bears, various African mammals, scavengers, terrestrial vertebrates, various small carnivores, forest ungulates, and more. These studies also varied in locations - Australia, Belize, Bolivia, Botswana, Brazil, Costa Rica, Ecuador, Mexico, Mongolia, New Zealand, South Africa, Tanzania, Uganda, United Kingdom, and the United States. Habitats included tropical broadleaf forests, temperate deciduous forests, savannas, a zoological park, and a college campus. The designs of these camera trap studies varied depending on scale, location, and species of interest.
Each study commonly defined each camera trap station as a single location where one or two camera traps were set up in order to investigate wildlife. These stations were then a part of a larger network of multiple stations. The quantity of camera stations used in these studies ranged between 3 and 225 (N = 1,537, mean = 38.43, median = 25, mode = 8). 52.5% of the studies used between 1-25 stations, 27.5% used between 26-50 stations, 10% used between 51-75 stations, 2.5% used between 76-100 stations, 2.5% used between 101-125 stations, and 5% used between 201-225 stations. Each station had one or two camera traps set up depending on the species of interest and the camera trap distribution. The studies ranged between 5 and 225 camera traps (N = 1,529, mean = 38.23, median = 34.5, mode = 8). 42.5% of studies used between 1-25 cameras, 35% used between 26-50 cameras, 10% used between 51-75 cameras, 7.5% used between 76-100 cameras, 2.5% used between 126-150 cameras, and 2.5% used between 201-225 cameras.
The camera trap studies were further analyzed by their length of study measured in number of days camera traps were in the field. Of the 40 individual camera trap studies, the maximum length was 1,305 days and the minimum length was 5 days (N = 11,402, mean = 285.05, median = 144, mode = 365). Of these studies, 57.5% were up to half a year in length (183 days). 22.5% were a full year in length. And lastly, 17.5% were multi year investigations. The maximum of 1,305 days of camera traps in the field came from an extended 14 year long study in Cockscomb Basin Wildlife Sanctuary, Belize (Harmsen et al., 2017).
Camera distribution methods also varied between studies. These methods were broken down into the following categories:
Locked Grid System: A grid of x number of cameras laid out across a squared parcel of land with cameras evenly spaced out at a specified distance from each other. Each camera trap grid point has its own camera trap (or two) that will stay in this location the entire time or be replaced if stolen or damaged. These grid systems often allow a certain distance within each central grid point to deviate from so that camera traps may be tied to optimal sized trees or near optimized settings like salt licks, water sources, game trails or more.
Rotating Grid System: A grid of x number of cameras laid out across a squared parcel of land with cameras evenly spaced out at a specified distance from each other. Each camera trap grid point will have a camera trap (or two) that will rotate through at consistent, designated intervals to save on cost of equipment. These grid systems often allow a certain distance within each central grid point to deviate from so that camera traps may be tied to optimal sized trees or near optimized settings like salt licks, water sources, game trails or more.
Locked Fixed Stations: Camera trap stations are chosen for optimal animal locations and will be locked in as permanent camera trap sites for the remainder of the study. Each locked station will have its own camera trap (or two) that will stay in this location the entire time or be replaced if stolen or damaged.
Rotating Fixed Stations: Camera trap stations are chosen for optimal animal locations and will have camera traps rotated through at consistent, designated intervals to save on cost of equipment.
Locked Transect Lines: Camera trap stations are chosen in straight lines or along winding trails. Each station point will have its own camera trap (or two), spaced out at consistent distances and will stay in this location the entire time or be replaced if stolen or damaged.
Rotating Randomly Selected Locations: Camera traps are provided to volunteers that randomly rotate cameras on their property.
The analysis of these 40 camera trap studies provided data showing that 40% of the studies preferred the use of locked transect lines. Grid systems were also highly favored, comprising a total of 30% of the studies with a total of 25% being locked and 5% rotating cameras. Fixed stations were nearly equally favored as grid systems making up 27.5% of the studies with a total of 12.5% locked and 15% rotating cameras. The least favored distribution method was rotating randomly selected locations at just 2.5%. Out of the 40 camera trap studies, 31 provided information on the distance between cameras. The maximum was 5,000 meters, the minimum was 193 meters, with a mean of 1,252.63 meters. Furthermore, 21 of the studies provided information on the height camera traps were set at. These heights ranged from 10 cm to 70 cm depending on the species of interest but had a mean of 56.25 cm (median = 62.5, mode = 70).
4.2 Review of Camera Trap Specs
In addition to analyzing field studies, I organized various camera trap models still in production as of 2018, cited by the 40 individual camera trap studies* as well as a survey compiled by Utter (2018). See Table 1.0 below.
Table 1.0 - Specs** for popular camera trap models used in wildlife research studies
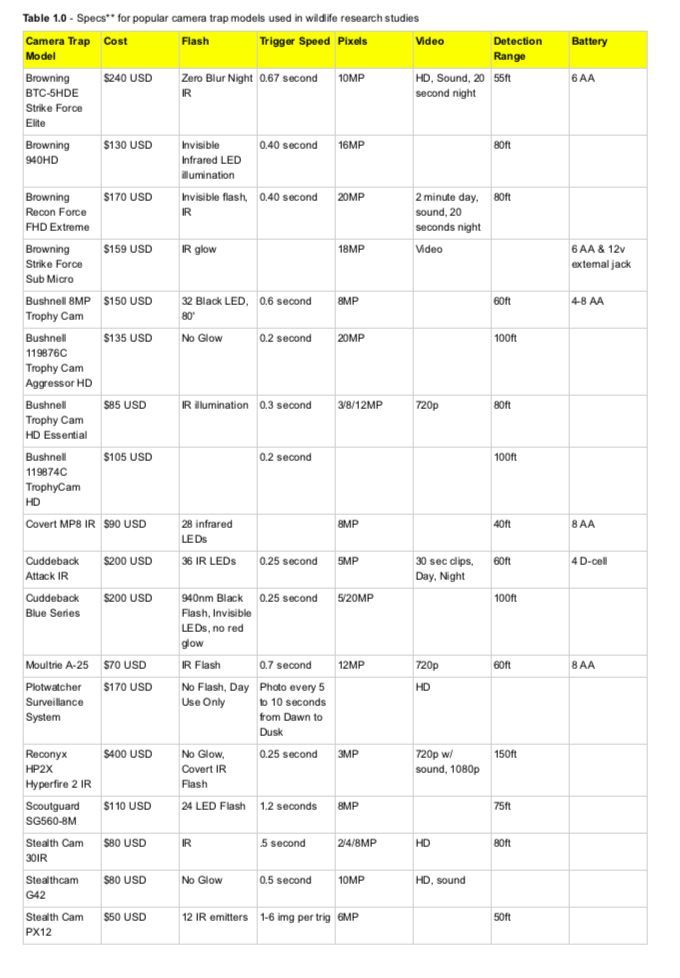
*See Works Cited
**All data sourced from Amazon.com (2018).
The present day inventory of camera traps provides an array of options, most providing infrared sensors (IR) (Swann et al., 2011). IR sensors are most ideal as they are triggered by sudden temperature changes and aid in preventing false positives (photo without animal) (Swann et al., 2004; Welbourne et al., 2016) while also preventing the likelihood of spooking certain species with an LED flash (Meek et al., 2016). Furthermore, by locking an IR flash camera trap in night mode, rosettes and spots can be seen on melanistic animals like leopards and jaguars, allowing individual identification (Hedges et al., 2015). Despite these benefits, they are still not immune to false positives. IR sensors may accidentally be triggered by raindrops, wind moving vegetation, or sunlight entering the detection zone (Swann et al., 2004; Welbourne et al., 2016). Another factor to consider is the detection zone as false negatives (animal is not photographed) can prevent collection of data. Factoring in a camera trap’s detection zone can limit these false negatives by selecting models with larger sensors (Rowcliffe, 2008).
5. Discussion
When starting a camera trap study, budget becomes the first factor one must consider. This will determine the quality as well as the number of camera traps you can purchase. This is the primary reason my data shows 42.5% of studies used 25 or less camera traps and why 77.5% used 50 or less camera traps. While Newey et al. (2015) recommends purchasing higher end camera traps to mitigate potential issues with sensors, settings, and general equipment failure overtime, it is noted that many mid-range models can provide enough options to be effective. Detection rates often vary greatly between camera trap models (Meek & Pittet, 2012; Meek et al., 2012; Glen et al., 2013) but ensuring the ability to cover the study area is also important (Ancrenaz et al., 2012). With prices ranging from $80 to $600 US (Ancrenaz et al., 2012), a researcher must heavily research the hundreds of camera trap models available for purchase before committing to any model type. It may even be worth reaching out to colleagues in the field for personal opinions or to even borrow camera traps to test at home to see how the settings match your own needs. In addition to camera trap costs, it is crucial to factor in a well rounded budget for batteries as infrared flash and video settings can often drain the battery life and may need to be replaced every 2-6 weeks, especially in colder environments (Newey et al., 2015). With the combined costs adding up, Silver, (2004) and Parsons et al., (2018) suggest that using fewer cameras in a rotating system can reduce this expense but will inversely increase the effort. A combined 22.5% of studies analyzed used rotation methods to save on cost in comparison to locked methods comprising of 77.5%. It is crucial to note that despite these percentages contrasting greatly with Silver, (2004) and Parsons et al., (2018), only 5 individual locked method studies, or 12.5%, surpassed using 50 camera traps or more, continuing to minimize their budgetary expenses.
While setting up cameras, one camera per site may suffice if you are looking to obtain data on species without unique markings (Edelman & Edelman, 2017; Parsons et al., 2018) but for species with unique patterns on their fur such as jaguars or tigers, setting up two cameras with opposite views of each other will have the ability to document both sides of the individual animal and give you well rounded data to identify individuals into the future (Silver, 2004; Harmsen et al., 2017). When it comes to choosing the sites, grids are often recommended across an animal’s home range, particularly species that live in low density, (Silver, 2004; Ancrenaz et al., 2012; Harmsen et al., 2017) to increase the probability of success while removing random variables or bias. My investigation showed grid systems comprising 30% of the studies. As this method has the potential to cover large parcels of land, it can require many cameras if utilized in a locked grid system method which may constrain the commonality of this methodology. Silver, (2004) provides further detail into setting up camera traps no more than 100m from the prescribed camera trap station location. This allows for varied camera trap set up with the differences in tree width, vegetation interference on the sensor, but also for selecting optimal settings for trigger events. Ultimately, knowing the species of interest’s prefered comforts will increase the likelihood of receiving positive trigger events. For example, by setting up along game trails, man-made trails, open roads, overgrown logging roads, salt licks, river or stream beds, or at seasonal ponds within an animal’s habitat, you will greatly increase your odds of photographing the species (Silver, 2004; Edelman & Edelman, 2017; Harmsen et al., 2017; Parsons et al., 2018). My data further recommends this methodology as 77.5% of the studies used locked and/or fixed locations that all allowed for optimal habitat use within a designated distance from the grid points center. With only 2.5% of studies using rotating random locations, this is likely due to the low capture rate and probability (Tobler & Powell, 2013). To further increase the odds of positive trigger events (photo of animal) and minimize false positives (i.e. image capture of vegetation movement from wind), Parsons et al., (2018) recommends setting a camera trap up 40cm from the ground, tied around a tree but to remain cautious of the camera’s sensitivity settings as they can vary and often be overly sensitive, resulting in mass data collection of false positives as well as dead batteries. These recommendations will vary from study to study as species of interest change. For example, Glen et al., (2013) recommends 10 cm when investigating small mammals and turning sensitivity settings on high to catch the small mammals movements. In other situations, a height of 75 cm with lower sensitivity settings was recommended for taller species (Rowcliffe, 2008).
Site checks refer to collecting the data stored on the memory cards, replacing batteries, and/or replacing entire camera trap units if need be. Back when camera trap data was recorded on film, site checks were needed anywhere from every 4-14 days (Silver, 2004) but with the digital camera traps of today, it is best to limit site checks to once per month or longer if possible, to limit the contamination of the camera traps with the human scent as it can act as a deterrent to certain wildlife species if visited too often (Parsons et al., 2018). Of course this can vary from species to species as with Edelman & Edelman (2017), the study took place on college campuses to study species that are fairly habituated to the human landscape. This would vary greatly from species far more precautious of humans like wild felids, canids, or herbivores often hunted by humans. While collecting the camera traps’ mass amounts of photographic data, it can become overwhelming and will be crucial to have reliable large file storage and backup hard drives to analyze back in the office (Harris et al., 2010; Sundaresan et al., 2011; Hamel et al., 2013).
With the large amounts of unbiased and ecologically valuable data recorded by the camera traps (Meek & Pittet, 2012; Burton et al., 2015; Meek et al., 2015), analysis will need to remain a priority as falling behind on the ever growing photographic data is likely to occur (Sundaresan et al., 2011; Newey et al., 2015). This analysis may be made easier by the use of software like eMammal (Parsons et al., 2018), CAPTURE (Silver, 2004, Janecka et al., 2011), CameraBase (Williams et al., 2018), EXIFPRO (Meek et al., 2016), Galaxy Zoo (Shiel et al., 2013), PhotoSpread (Sundaresan et al., 2011) Zooniverse (Swanson et al., 2015), CamTrapR, WildID, Hotspotter, Excel, DigiCam, MapView, and Wildlife Insights (Utter, 2018) that can help to categorize the species photographed and pull and sort data that includes capture/recapture, daily faunal detection and inventory, detection/non-daily detection per species for occupancy modeling, relative activity per species, habitat association, abundance and density estimations, as well as various species specific studies (Silver, 2004; Edelman & Edelman, 2017; Parsons et al., 2018). With the large effort camera trap studies undertake and the mass amounts of collected data at hand, Brewer, (2002), Edelman & Edelman, (2017), and Margurran et al., (2010) state that recruiting citizen scientist volunteers and developing mutually beneficial relationships can aid conservation scientists in collecting, managing and processing data for long-term studies into local ecologies while simultaneously empowering citizen scientists through meaningful work. Platforms such as eMammal already offer the possibilities for classrooms to participate in camera trap studies (McShea et al., 2016). Furthermore, this provides the citizen scientists with knowledge growth and personal experience to make better decisions and resolve ecological issues within their communities (Reed et al., 2013).
As citizen science programs have opportunities to create connections to different ecological issues, recruiting and training local community members and/or students is a great opportunity to create environmental awareness in a region (Swann and Perkins, 2014). By including the locals, participants have an opportunity to grow their scientific literacy, further increasing public knowledge, and developing concern for human impact on ecological issues (Conrad & Hilchey, 2010). This is due to providing the local citizen scientists with ownership of their work which in turn creates motivation, engagement, and ultimately a sense of achievement in conservation science (Evans et al., 2005; Jordan et al., 2011; Forrester et al., 2016; Edelman & Edelman, 2017). Parsons et al., (2018) has found that including volunteers through citizen science created knowledge in natural systems, created awareness of the species they live amongst, encouraged human behaviors to adapt, further reducing risk of human wildlife conflict, and made them feel more connected to science in general. Additionally, they observed that students with varied abilities were able to participate and grow. For example, the use of camera traps aided the development of verbal skills for a college student-citizen scientist with autism. By developing ecological knowledge, attitudes, and behaviors in local stakeholders, camera trap programs have an ability to create social capital and increase opportunities for their community to live harmoniously within the ecosystem.
7. Conclusions
As the commonality of camera trap studies continues to grow, it is important to analyze these studies for trends into what make them successful. These factors will vary depending on landscape, species of interest, and budgets. Researchers need to assess these factors and adapt an implementation plan accordingly. When landscapes are particularly challenging, utilizing transect lines is an effective strategy to obtain primary data on wildlife presence (Rovero & Marshall, 2009; Blake et al., 2014). With species in low density, utilizing a grid system across a species known home range size increases probability of high capture rate (Silver, 2004). In areas of higher species density, utilizing fixed stations placed in optimal locations can provide enough cover to obtain bountiful primary data (Porfiero, 2018). These distribution methods in correlation with a research budget will then determine whether enough camera traps can be purchased to cover each camera trap station or if rotating fewer cameras is ideal to maximize successful data collection.
With the vast amounts of data that camera trap studies collect, it is vital to garner support in data analysis from the general public as citizen scientists. This could come from many different outlets such as partnering with local high schools, colleges, or opening the opportunity up to anyone interested in wildlife. This assistance could come from the citizens living amongst the species being investigated to garner ecological friendly attitudes and behaviors but could also be supported digitally around the world like Zooniverse - Snapshot Serengeti (Rovero & Marshall, 2009). Furthermore, with the various distribution methods requiring large amounts of time for data retrieval, finding local community members to to volunteer as data collection team members and citizen scientists will further provide support within the stakeholder’s community by giving ownership and building capacity while simultaneously reinforcing a connection to nature and wildlife.
8.Works Cited
Ahumeda, J. A., Hurtado, J., & Lizcano, D. (2013). Monitoring the status and trends of tropical forest terrestrial vertebrate communities from camera trap data: A tool for conservation. PLoS ONE, 8(9): e73707.*
Ancrenaz, M., Hearn, A. J., Ross, J., Sollmann, R., & Wilting, A. (2012). Handbook for wildlife monitoring using camera-traps. BBEC, Sabah, Malaysia.
Blake, J. G., Mosquera, D., Guerra, J., Loiselle, B. A., Romo, D., & Swing, K. (2014). Yasuni - a hotspot for jaguars Panthera Onca (Carnivora: Felidae)? Camera-traps and jaguar activity at Tiputini Biodiversity Station, Ecuador. International Journal of Tropical Biology, 62(2): 689-698.*
Borchers, D., Distiller, G., Foster, R., Harmsen, B., & Milazzo, L. (2014). Continuous-time spatially explicit capture-recapture models, with an application to a jaguar camera-trap survey. Methods in Ecology and Evolution, 5: 656-665.
Boyd, C., Brooks, T. M., Butchart, S. M., Edgar, G. J., Da Fonseca, G. B., Hawkins, F., & ... Van Dijk, P. (2008). Spatial scale and the conservation of threatened species. Conservation Letters, 1(1), 37-43.
Boyer-Ontl, K. M., & Pruetz, J. D. (2014). Giving the forest eyes: The benefits of using camera traps to study unhabituated chimpanzees (Pan troglodytes verus) in Southeastern Senegal. International Journal of Primatology, 35(5): 881-894.
Brewer, C. (2002). Outreach and Partnership Programs for Conservation Education Where Endangered Species Conservation and Research Occur. Conservation Biology, 16(1), 4-6. doi:10.1046/j.1523-1739.2002.01613.x.
Burton, A. C., Neilson, E., Moreira, D., Ladle, A., Steenweg, A., Fisher, J. T., Bayne, E., & Boutin, S. (2015). Wildlife camera trapping: A review and recommendations for linking surveys to ecological processes. Journal of Applied Ecology. doi:10.1111/1365-2664.12432.
Chetkiewicz, C., St. Clair, C., & Boyce, M. (2006). Corridors for conservation: Integrating pattern and process. Annual Review of Ecology, Evolution, and Systematics, 37, 317-342.
Conrad, C. C., & Hilchey, K. G. (2010). A review of citizen science and community based environmental monitoring: Issues and opportunities. Environmental Monitoring and Assessment, 176(1-4), 273-291. doi:10.1007/s10661-010-1582-5.
Danielsen, F., Mendoza, M. M., Tagtag, A., Alviola, P. A., Balete, D. S., Jensen, A. E., Enghoff, M., & Poulsen M. K. (2007). Increasing conservation management action by involving local people in natural resource monitoring. Ambio, 36: 566-570.
Edelman, A. J., & Edelman, J. L. (2017). An inquiry-based approach to engaging undergraduate students in on-campus conservation research using camera traps. The Outdoor Classroom, 16(10): 58-69.*
Evans, C., Abrams, E., Reitsma, R., Roux, K. Salmonsen, L., & Marra, P. P. (2005). The neighborhood Nestwatch program: participant outcomes of a citizen-science ecological research project. Conservation Biology, 19: 589-594.
Forrester, T. D., Baker, M., Costello, R., Kays, R. Parsons, A. W., & McShea, W. J. (2016). Creating advocates for mammal conservation through citizen science. Biological Conservation. 208: 98-105.
Forrester, T. D., & McShea, W. J. (n.d.). eMammal summary of science procedures using camera traps. Smithsonian Conservation Biology Institute. Retrieved from: https://emammal.si.edu/system/files/emammal-academy/curriculum/virginia/shared/Supplement1_CameraTrappingOverview.pdf
Glen, A. S., Cockburn, S., Nichols, M., Ekanayake, J., & Warburton, B., (2013). Optimising camera traps for monitoring small mammals. PLoS ONE, 8(6) doi.org/10.1371/journal.pone.0067940
Glen, A. S., Anderson, D., Veltman, C. J., Garvey, P. M., & Nichols, M. (2016). Wildlife detector dogs and camera traps: a comparison of techniques for detecting feral cats. New Zealand Journal of Zoology, 43(2): 127-137.*
Goldman, C. (2006). Mythical jaguars face harsh reality. World & I, 21(7): 24.
Gutiérrez-González, C. E., & López-González, C. A. (2017). Jaguar interactions with pumas and prey at the northern edge of jaguars’ range. PeerJ, 5, e2886.
Hamel, S., Killengreen, S. T., Henden, A. A. Eide, N. E., RoedErikson, L., Ims, R., & Toccoz, J. A. (2013). Towards good practice guidance in using camera-traps in ecology: influence of sampling design on validity of ecological interferences. Methods in Ecology and Evolution, 4: 105-113.
Harmsen, B. J., Foster, R. J., Sanchez, E., Gutierrez-Gonzalez, C. E., Silver, S. C., Ostro, L. E. T., Kelly, M. J., Kay, E., & Quigley, H. (2017). Long term monitoring of jaguars in the Cockscomb Basin Wildlife Sanctuary, Belize; Implication for camera trap studies of carnivores. PLOS One, 12(6): 1-19.*
Harris, G., Thompson, R., Childs, J. L., & Sanderson, J. G. (2010). Automatic storage and analysis of camera trap data. Bulletin of the Ecological Society of America, 91: 352-360.
Hedges, L. Lam, W. Y., Campos-Arceiz, A., Rayan, D. M., Lauranca, W. F., Latham, C. J., Saaban, S., & Clements, G. R. (2015). Melanistic leopards reveal spots: Infrared camera traps provide a population density estimate of leopards in Malaysia. Journal of Wildlife Management, 79(5): 846-853.
Iriarte, J. A., Franklin, W. L., Johnson, W. E., & Redford, K. H. (1990). Biogeographic variation of food habits and body size of the America puma. Oecologia, 85 (2): 185–190.
Janecka, J. E., Munkhtsog, B., Jackson, R., Naranbaatar, G., Mallon, D. P., & Murphy, M. J. (2011). Comparison of noninvasive genetic and camera-trapping techniques for surveying snow leopards. Journal of Mammalogy, 92(4): 771-783.*
Jordan, R. C., Gray, S. A., Howe, D. V., Brooks, W. R., & Ehrenfeld, J. G. (2011). Knowledge gain and behavioral change in citizen-science programs. Conservation Biology, 25: 1148-1154.
Kudryavstev, A., Stedman, R.C., & Krasny, M.E. (2012). Sense of place in environmental education. Environmental Education Research, 18 (2), 229-250.
Magurran A. E., Baillie, S. R., Buckland, S. T., Dick, J. M., Elston, D. A., Scott, E. M., Smith, R. I., Somerfield, P. J., & Watt, A. D. (2010). Long-term datasets in biodiversity research and monitoring: Assessing change in ecological communities through time. Trends in Ecology & Evolution, 25: 574-582.
McShea, W. J., Forrester, T., Costello, R., He, Z., and Kays, R. (2016). Volunteer-run cameras as distributed sensors for macrosystem mammal research. Landscape Ecology, 31(1): 55-66.
Meek, P. D., & Fleming, P., & Ballard, G. (2012). An introduction to camera trapping for wildlife surveys in Australia. Canberra: Invasive animals CRC.
Meek, P. D., & Pittet, A. (2012). User-based design specifications for the ultimate camera trap for wildlife research. Wildlife Research, 39: 649. doi:10.1071/WR12138.
Meek, P. D., Ballard, G. A., & Fleming, P. J. S. (2015). The pitfalls of wildlife camera trapping as a survey tool in Australia. Australian Mammalogy, 37: 13. doi:10.1071/AM14023.
Meek, P. D., Ballard, G., Fleming, P., & Falzon, G. (2016). Are we getting the full picture? Animal responses to camera traps and implications for predator studies. Ecology and Evolution, 6(10): 3216-3225.*
Newey, S., Davidson, P., Nazir, S., Fairhurst, G., Verdicchio, F., Irvine, R. J., & Van der Wal, R. (2015). Limitations of recreational camera traps for wildlife management and conservation research: A practitioner’s perspective. Ambio, 44(4): 624-635.*
Norris, K. S., & Jacobson, S. K. (1998). Content Analysis of Tropical Conservation Education Programs: Elements of Success. The Journal of Environmental Education,30(1), 38-44. doi:10.1080/00958969809601862.
Nunez-Perez, R. (2011). Estimating jaguar population density using camera-traps: a comparison with radio-telemetry estimates. Journal of Zoology, 285: 39-45.*
Parsons, A. W., Goforth, C., Costello, R., & Kays, R. (2018). The value of citizen science for ecological monitoring of mammals. PeerJ, 1-21.*
Porfirio, G., Foster, V. C., Sarmento, P., & Fonseca, C. (2018). Camera traps as a tool for Carnivore conservation in a mosaic of Protected Areas in the Pantanal wetlands, Brazil. Nature Conservation Research: Zapovednaâ Nauka, 3 (2): 57-67.*
Rademaker, M., Rode-Margono, E. J., & Weterings, M. J. A. (2017). Estimation of species area abundance from point abundance data, using effective detection areas from camera traps. Journal of Biodiversity & Endangered Species, 5(6): 1-6.
Raices, D. S. L., Ferreira, P. M., Mello, J. H. F., & Bergallo, H. G. (2017). Smile, you are on camera trap or in a live trap! The role of mammals in dispersion of jackfruit and native seeds in Ilha Grande State Park, Brazil. Nature Conservation Research, 2(4): 78-89.
Rainforest Foundation UK. (2011), How to Map, Part 1: Mapping For Rights [Video file]. Retrieved from https://www.youtube.com/watch?t=24&v=qRhYktaBWYg
Reed, J., Raddick, M. J., Lardner, A., and Carney, K. (2013). An exploratory factor analysis of motivations for participating in Zooniverse, a collection of virtual citizen science projects. Proceedings of the Annual Hawaii International Conference on System Sciences, 610-619.
Rich, L. N., Miller, D. A. W., Robinson, H. S., McNutt, J. W., & Kelly, M. J. (2016). Using camera trapping and hierarchical occupancy modelling to evaluate the spatial ecology of an African mammal community. Journal of Applied Ecology, 53: 1225-1235.*
Rovero, F., & Marshall, A. (2009). Camera trapping photographic rate as an index of density in forest ungulates. Journal of Applied Ecology, 46: 1011-1017.*
Rocheleau, D. (2005). Maps as power tools: Locating communities in space or situating people and ecologies in place? From Brosius, J.P., Tsing, A.L. and Zerner, C. (eds.), Communities and Conservation. New York, NY: Altamira Press. Chapter 13, pp. 327-362.
Rowcliffe, J. M., Field, J., Turvey, S. T., & Carbone, C. (2008). Estimating animal density using camera traps without the need for individual recognition. Journal of Applied Ecology, 45: 1228-1236.*
Shiel, D., Murgerwa, B., & Fegraus, E. H. (2013). African golden cats, citizen science, and serendipity: Tapping the camera trap revolution. South African Journal of Wildlife Research, 43(1): 74-78.*
Silver, S. C., Ostro, L. E. T., Marsh, L. K., Maffei, L., Noss, A. J., Kelly, M. J., Wallace, R. B., Gomez, H., & Ayala, G. (2004). The use of camera traps for estimating jaguar Panthera onca abundance and density using capture/recapture analysis. Oryx, 38(2): 148-154.*
Steinberg, M. K. (2016). Jaguar conservation in southern Belize: Conflicts, perceptions, and prospects among Mayan hunters. Conservation & Society, 14(1): 13-20.
Sultana, P., & Abeyasekera, S. (2008). Effectiveness of Participatory Planning for Community Management of Fisheries in Bangladesh. Journal of Environmental Management, 86(1), 201-213. doi:10.1016/j.jenvman.2006.12.027.
Sundaresan, S. R., Riginos, C., & Abelson, E. S. (2011). Management and analysis of camera trap data: Alternative approaches (response to Harris et al. 2010). Bulletin of Ecological Society of America, 92: 188-195.
Swann, D. E., Hass, C. C., Dalton, D. C., & Wolf, S. A. (2004). Infrared-triggered cameras for detecting wildlife: An evaluation and review. Wildlife Society Bulletin, 32(2): 357-365.
Swann, D. E., Kawanishi, K., & Palmer, J. (2011). Evaluating types and features of camera traps in ecological studies: a guide for researchers. Springer: Camera Traps in Animal Ecology: Methods and Analysis, Chapter 3, 27-43.
Swann, D. E., & Perkins, N. (2014). Camera trapping for animal monitoring: Case studies. Camera Trapping: Wildlife Management and Research, chapter 1, 3-12.
Swanson, A., Kosmala, M., Lintott, C., Simpson, R., Smith, A., & Packer, C. (2015). Snapshot Serengeti, high-frequency annotated camera trap images of 40 mammalian species in an African savanna. SCIENTIFIC DATA, 2:150026.*
Taber A. B., Novaro A. J., Neris N., & Colman F. H. (1997). The food habits of sympatric jaguar and puma in the paraguayan chaco. Biotropica, 29: 204-213.
Tobler, M. W., & Powell, G. V. N. (2013). Estimating jaguar densities with camera traps: Problems with current designs and recommendations for future studies. Biological Conservation, 159: 109-118.
Utter, S. (2018). Assessment of Camera Trap Analysis Methods. Unpublished Paper.
Welbourne, D. J., Claridge, A. W., Paull, D. J., & Lambert, A. (2016). How do passive infrared triggered camera-traps operate and why does it matter? Breaking down common misconceptions. Remote Sensing in Ecology and Conservation, 2(2): 77-83.
Williams, S. T., Maree, N., Taylor, P., Belmain, S. R., Keith, M., & Swanepoel, L. H. (2018). Camera trap and questionnaire dataset on ecosystem services provided by small carnivores in agro-ecosystems in South Africa. Elsevier, 18: 753-759.*
Zanin, M., Sollmann, R., Torres, N., Furtado, M., & Jácomo, A. T. A., Silveira, L., & De Marco Júnior, P. (2015). Landscapes attributes and their consequences on jaguar Panthera onca and cattle depredation occurrence. European Journal of Wildlife Research, 61(4): 529-537.
*Indicates publications utilized in literature review of the 40 individual camera trap studies
Adam J. Dewey, Miami University - Global Field Program, M.A. Biology